
AI & Digital
Business Intelligence & KPI Dashboard
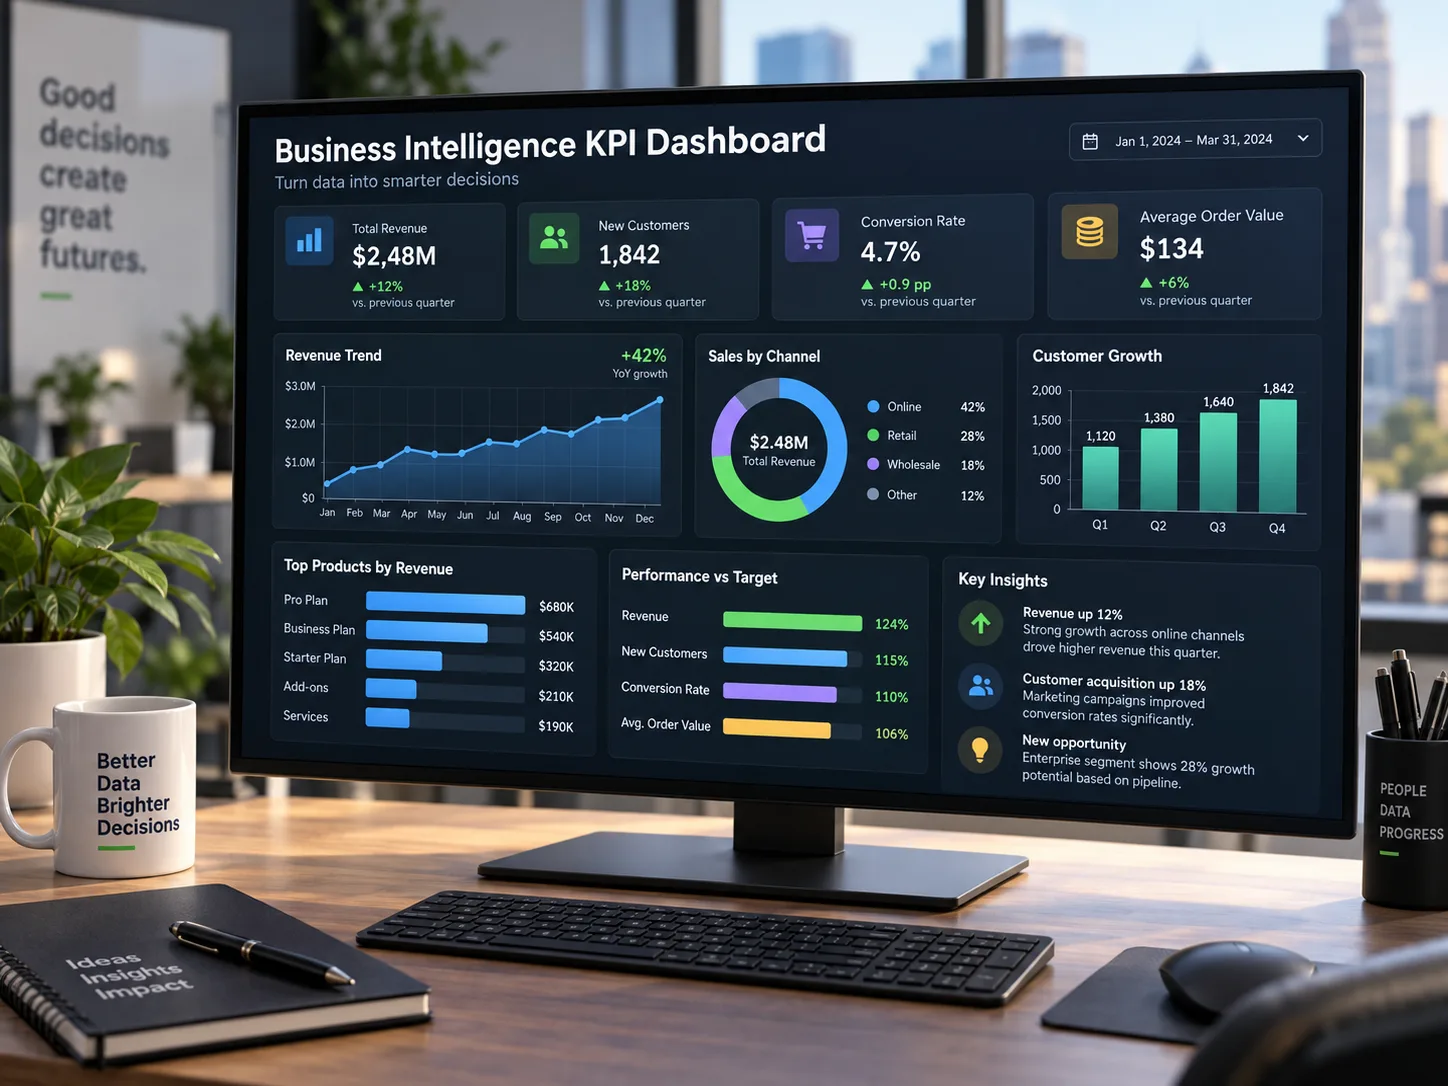
Interactive dashboards and automated reporting that turn operational data into clear, drill-down KPIs, with predictive analytics layered in where the underlying data supports it.
When You Need It
Data is spread across disconnected systems with no single trustworthy view.
What KTS Does
We turn operational data into clear, drill-down KPI dashboards.
What Changes
Leadership gets one dependable view of performance, not competing spreadsheets.
When every team has a different number for the same thing
Data spread across disconnected systems is hard to turn into a single, trustworthy view of how the business is performing.
Our BI dashboards turn operational data into clear, drill-down KPIs, with predictive analytics layered in where the underlying data supports it.
What We Offer
What we can help with
Power BI Integration
Dashboards built on the reporting tools your team already knows.
Custom KPIs
Metrics tracked against what actually matters to your business.
Automated Reports
Scheduled reports generated without manual compilation.
Data Visualisation
Clear, drill-down visuals instead of static spreadsheet exports.
Drill-Down Analysis
The ability to move from a top-line number to the detail behind it.
Who This Is For
When this is useful
- Leadership teams without a single source of performance truth
- Organisations with data spread across disconnected systems
Technologies & Platforms
What we build with
Related
Delivered as part of these services
Let's discuss business intelligence & kpi dashboard.
Tell us about your organisation and we'll map out the right approach together.